Hi all, thanks for your help
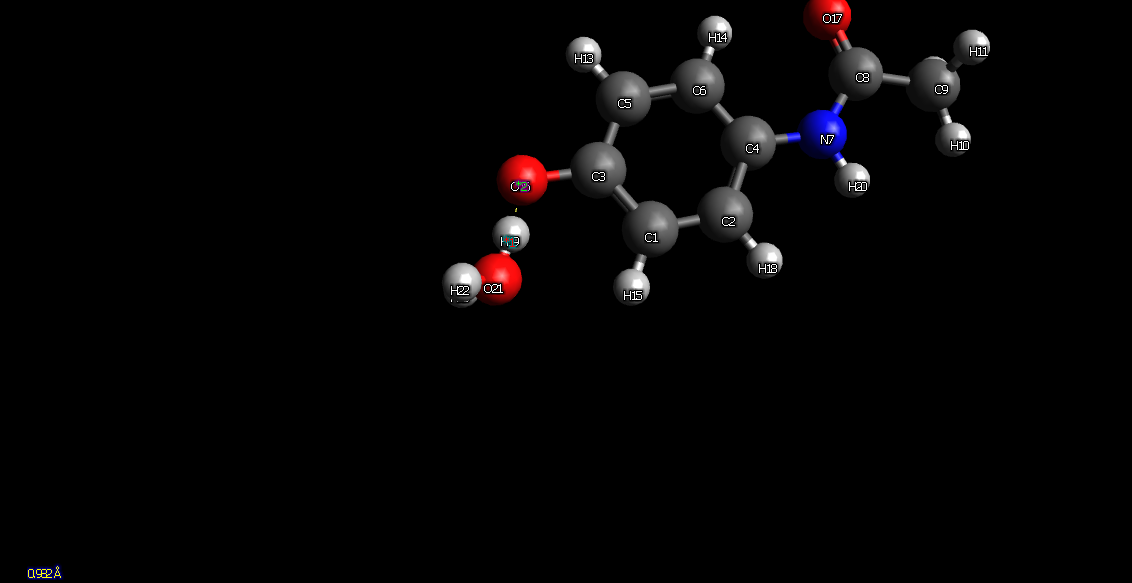
I have several paracetamol - water systems with different hydrogen bond arrrangement, I have the xyz and I want to run SAPT with varying hydrogen bond length.
When the oxygen of the water is bonded, I can use python to set a variable bond length ok using the z matrix. However when its the hydrogen on the water its giving me an issue.
Below is my original code, and then where I have attempted to change the z matrix for H23-O17 hydrogen bond water-carbonyl. The error that psi4 gives me is error finding anchor atom (I cant understand what the anchor atom wants to be?)
import psi4
import numpy as np
import matplotlib.pyplot as plt
psi4.core.clean()
Set memory & output
psi4.set_memory(‘10 GB’)
distances is a list between 1 and 3 with steps of 0.1
distances = np.arange(1, 2.5, 1)
Define arrays for each energy component
eelst = np.zeros((len(distances)))
eexch = np.zeros((len(distances)))
eind = np.zeros((len(distances)))
edisp = np.zeros((len(distances)))
esapt = np.zeros((len(distances)))
for i in range(len(distances)):
dimera = psi4.geometry(“”"
C
C 1 B1
C 1 B2 2 A2
C 2 B3 1 A3 3 D3
C 3 B4 1 A4 2 D4
C 5 B5 3 A5 1 D5
N 4 B6 2 A6 1 D6
C 7 B7 4 A7 2 D7
C 8 B8 7 A8 4 D8
H 9 B9 8 A9 7 D9
H 9 B10 8 A10 7 D10
H 9 B11 8 A11 7 D11
H 5 B12 3 A12 1 D12
H 6 B13 5 A13 3 D13
H 1 B14 2 A14 3 D14
O 3 B15 1 A15 2 D15
O 8 B16 7 A16 4 D16
H 2 B17 1 A17 3 D17
H 16 B18 3 A18 1 D18
H 7 B19 4 A19 2 D19
B1 = 1.39307
B2 = 1.39768
A2 = 119.78699
B3 = 1.40027
A3 = 120.95173
D3 = 0.38809
B4 = 1.39843
A4 = 119.38579
D4 = 359.54954
B5 = 1.39195
A5 = 121.01984
D5 = 0.03229
B6 = 1.42093
A6 = 117.14439
D6 = 178.42414
B7 = 1.36779
A7 = 129.17507
D7 = 158.88037
B8 = 1.52169
A8 = 114.90323
D8 = 181.64036
B9 = 1.09459
A9 = 114.26759
D9 = 5.58560
B10 = 1.09505
A10 = 108.71935
D10 = 243.97262
B11 = 1.09385
A11 = 108.57214
D11 = 127.55471
B12 = 1.08536
A12 = 118.83811
D12 = 180.69181
B13 = 1.08225
A13 = 119.00426
D13 = 180.88286
B14 = 1.08826
A14 = 119.80699
D14 = 179.71864
B15 = 1.36835
A15 = 122.92248
D15 = 179.74570
B16 = 1.22855
A16 = 124.22890
D16 = 2.01755
B17 = 1.08826
A17 = 119.17279
D17 = 180.63051
B18 = 0.96974
A18 = 109.05272
D18 = 0.16373
B19 = 1.01055
A19 = 114.63239
D19 = 344.49601
–
O 14 B20 6 A20 5 D20
H 21 B21 14 A21 6 D21
H 21 B22 14 A22 6 D22
##edited z matrix H23-O17 ###
O 23 B22 6 A20 5 D20
H 21 B21 14 A21 6 D21
H 17 B23 14 A22 6 D22
B20 = 2.38573
A20 = 172.25185
D20 = 325.93828
B21 = 0.96913
A21 = 93.88434
D21 = 327.57979
B22 = 0.97535
A22 = 63.75962
D22 = 225.20235
B23 = “”" + str(distances[i]) + “”"
""")

psi4.set_options({'scf_type': 'df',
                  'freeze_core': 'true',
                  })
#
# # save the plotsapt calculation

psi4.energy('sapt0/jun-cc-pvdz', molecule=dimera)

eelst[i] = psi4.variable('SAPT ELST ENERGY')
eexch[i] = psi4.variable('SAPT EXCH ENERGY')
eind[i] = psi4.variable('SAPT IND ENERGY')
edisp[i] = psi4.variable('SAPT DISP ENERGY')
esapt[i] = psi4.variable('SAPT TOTAL ENERGY')

psi4.core.clean()
plotting
plt.plot(distances, eelst, label=‘Electrostatics’)
plt.plot(distances, eexch, label=‘Exchange’)
plt.plot(distances, eind, label=‘Induction’)
plt.plot(distances, edisp, label=‘Dispersion’)
plt.plot(distances, esapt, label=‘SAPT Total’)
plt.xlabel(‘Distance (Angstrom)’)
plt.ylabel(‘Energy (kcal/mol)’)
plt.legend()
plt.savefig(‘dimera_sapt.png’)
save the data as csv
data = np.column_stack((distances, eelst, eexch, eind, edisp, esapt))
np.savetxt(‘dimera_sapt.csv’, data, delimiter=‘,’,
header=‘Distance,Electrostatics,Exchange,Induction,Dispersion,SAPT Total’, comments=‘’)
plt.show()
Thanks!