Dear All,
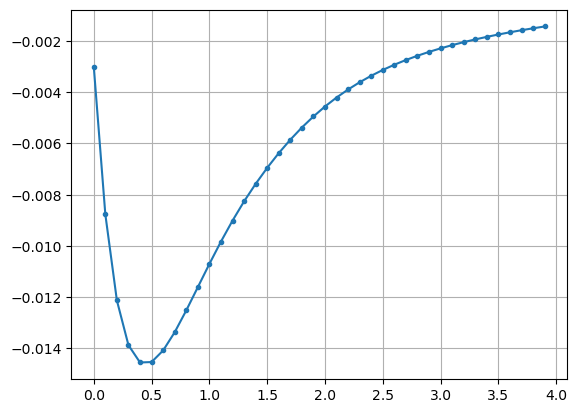
The energy vs Distance plot of a dimer is shown bellow. The initial structure is optimized. However the graph shows that there is configuration with less energy than the optimized structure. I find it odd and all the initiative to solve the problem will be appreciated.
out_scan.s-he2-on-nn.xyz (31.4 KB)
Please give more context for your question. I don’t understand what you’re asking.
I think you’re saying that you optimized a dimer geometry (at x = 0.0), but a simple “pull the two dimers apart” scan shows that the binding energy isn’t minimized there.
If that’s right, I need to know what method you used for the optimization to even try to reproduce this. A full output file would also help.
Yes, you are right. I used B3LYP and cc-pvdz level of theory. Please find the output of optimization.
out.txt (3.7 MB)
The geometry that Psi4 says is optimized isn’t the geometry that your scan starts with as its first point, at x=0.0. The O-H bond distance from Psi is 1.756 A, while the distance in your scan starting structure is 1.665. These are not the same.
Sorry for the mistake. please find the geom.xyz file of the optimisation here.
geoms.xyz (8.1 KB)
The final geometry is definitely not optimized. Are you absolutely sure that geometry came from a successful geometry optimization? I’m going to need to see an output file.
So you mean the final configuration in geom file is not the optimized geometry?
Correct, the final geometry in geoms.xyz is not an optimized geometry. The gradient is much too large.
ok. then it makes sense. thanks for the help.
For future reference, we’d appreciate if you spent the time to double-check things like “this geometry is optimized” before posting an issue about how your geometry isn’t optimized.
Us developers only have so much time to spend on Psi4.
This topic was automatically closed 60 days after the last reply. New replies are no longer allowed.